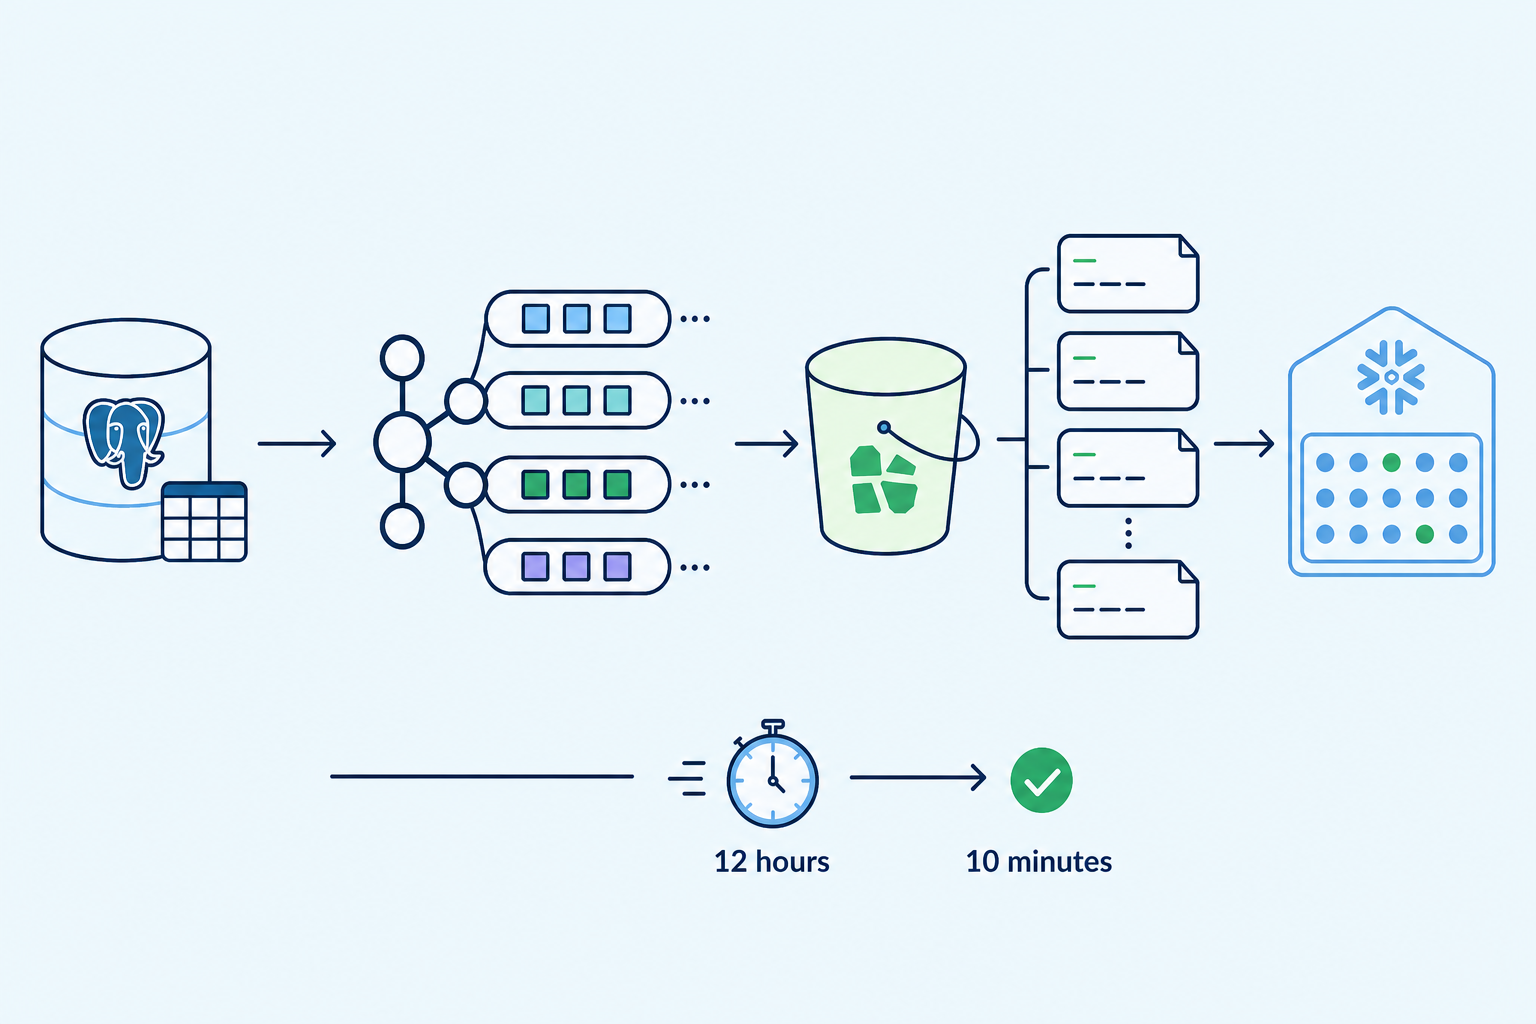
Data sits at the centre of every business decision at Branch, so how fast and reliably it reaches analysts shapes how fast we operate. We rebuilt our data warehouse ingestion pipeline, replacing a legacy twice-daily batch job with an event-driven Change Data Capture (CDC) platform and cutting the delay between a write hitting production and being queryable in the warehouse by more than 70x.
Our transactional core runs on AWS RDS Postgres databases: a primary database backing our monolith backend, plus a separate database capturing mobile app events. Together, they hold tens of TBs of data across 200+ tables, with several read replicas following leader-based physical replication. Scale is skewed: our largest append-only tables exceed 80 billion rows, versus hundreds of millions for mutable (update-heavy) tables. Snowflake serves as our central data warehouse for analytics and reporting, with pipelines orchestrated by Apache Airflow. What follows: the legacy system’s limits, how we redesigned around them, and the new platform’s impact.
The Legacy System: The Limits of Batch Ingestion
For every table, our legacy Airflow job looked up the high-water mark in Snowflake (max(created_at) or max(id)), then fired heavy COPY (SELECT * ...) queries against the Postgres read replicas, filtered on created_at/ updated_at to pull everything created or updated since the last run. Because Postgres COPY exports only rows, tasks buffered result sets in Airflow worker memory – a fragile scaling ceiling – wrote to S3, and ran Snowflake’s COPY INTO to stage files and MERGE to upsert them.
The deeper problem was at the source: created_at and updated_at columns were not indexed, forcing sequential scans on every table, every run. Append-only tables (like app events) bypassed this on a separate pipeline, filtering on the indexed primary key id to avoid the sequential-scan penalty of mutable tables.
Database Strain
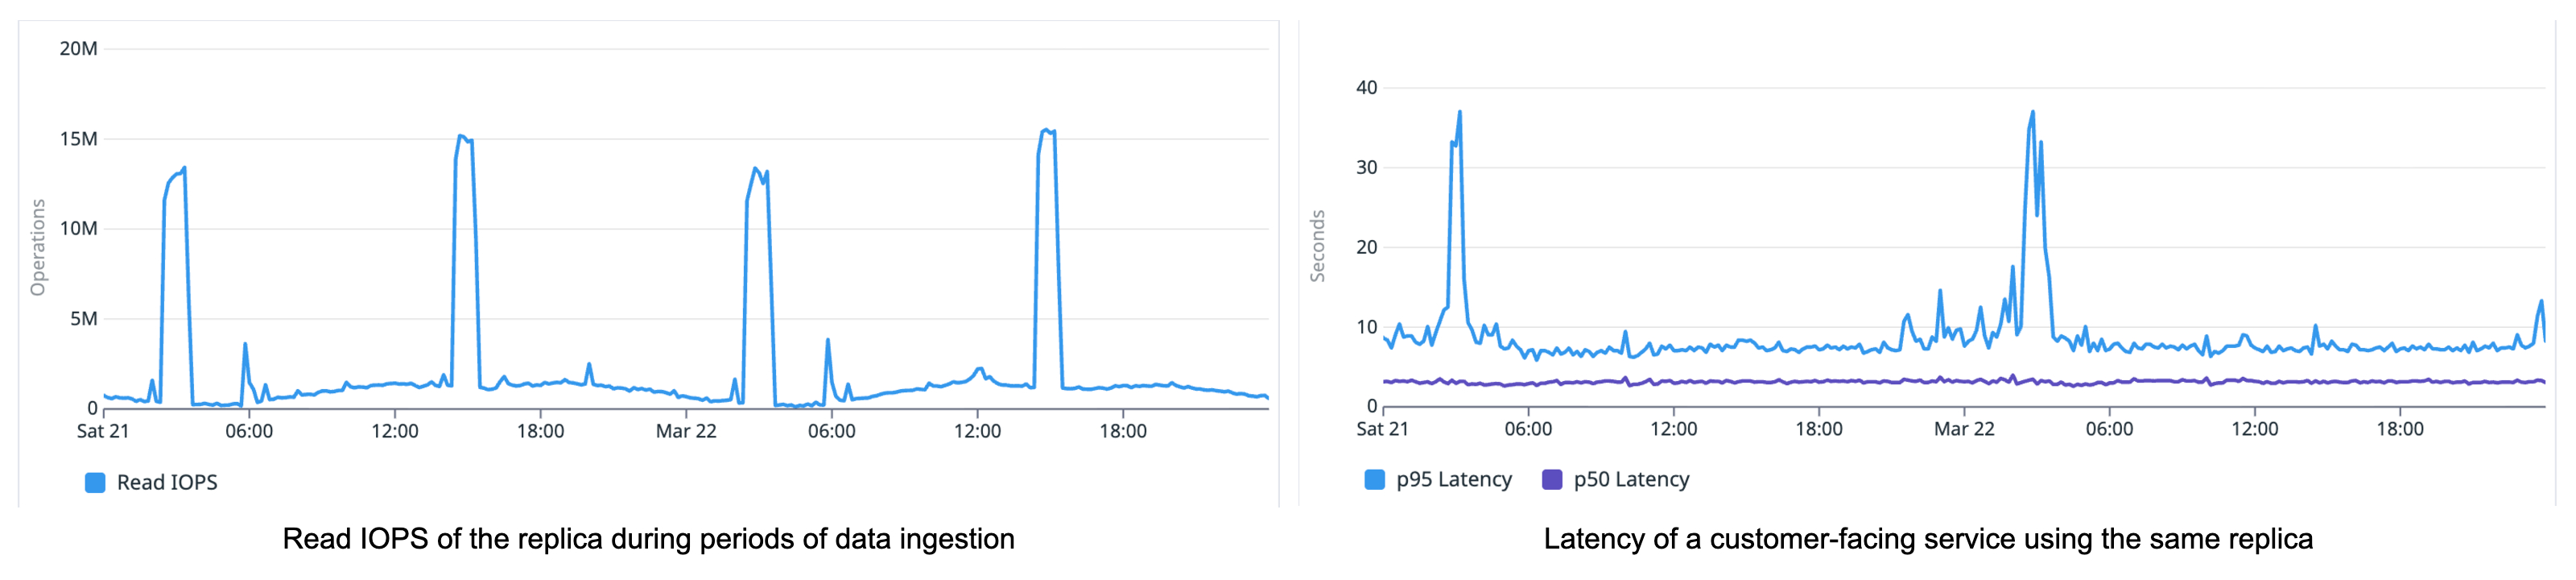
These concurrent sequential scans were expensive, quickly consuming most of the replica’s available IOPS. Once the burst-IOPS balance was exhausted and the engine fell back to baseline IOPS, the still-running queries throttled, dragging everything down with them.
That contention spilled over to customer-facing services sharing the replica, adding latency to critical flows like customers receiving loan offers, and causing frequent replica lag during every ingestion window. Even brief, once-a-day latency spikes ran against our commitment to delivering the best possible customer experience.
Data Latency
Running every 12 hours, the pipeline still took around 2 hours even at high per-table parallelism, capped by Postgres scan speeds. Running it more often would have stayed sharply bottlenecked and piled even more pressure onto RDS.
This bottlenecked our product and business analytics teams: RCAs were slow, and scaling an experiment cost an extra day waiting for data to land. A 12-13 hour lag was acceptable in the early days, but our data and business quickly outpaced it.
Unreliable Accuracy
To stay predictable, each batch capped its created_at filter at the pipeline’s start time, deferring rows created mid-run to the next batch. We couldn’t apply the same upper bound to updates, though. That would have missed rows updated inside the window but updated again just after the batch began. This bred discrepancies. When the backend soft-deletes rows (setting status = invalid) and inserts fresh entries for the same entity within one transaction, the status updates on the old rows were captured, but the new rows weren’t, until the following batch, leaving the entity inconsistent. Cross-table consistency slipped similarly: a loan might appear as disbursed while its EMIs were still missing from the warehouse.
The pipeline also leaned on created_at and updated_at being correct, but these are set by the ORM at the application layer, not the database. Application-side timestamping introduces edge cases during long-running or bulk transactions and creates race conditions: a transaction that starts at 01:59 (stamping created_at = 01:59) but commits at 02:02 is missed by the 02:00 batch (not yet committed) and by the next batch too (its timestamp predates 02:00) – silently lost.
Finally, the batch pipeline had no way of capturing hard deletes; our rare hard-delete scenarios had to be reconciled through a separate flow, independent of data ingestion.
Accuracy of 99.99% might be fine for a product experiment, but not for regulatory reporting. We strive for nothing short of 100% in what we report to credit bureaus and other compliance entities, and these edge cases stood in the way.
The Goal: What We Were Looking For
- Sub-10-minute latency for data landing in the warehouse
- No negative impact on backend services or the source databases
- Guaranteed at-least-once delivery of every update for a table, correctly handling write race conditions
- 100% accuracy in the data replicated into the warehouse
- Headroom to handle upto 10x our current load
- Builds on the data already in Snowflake, rather than re-ingesting everything into a brand-new platform
- A decoupled, extensible architecture that supports current and future analytics needs and makes adding new database event consumers easy
- No disruption to existing Snowflake consumers: no performance impact, zero operational downtime, and full continuity of our strict data access-control and security policies
- Additional cost kept within reasonable bounds; cost mattered even though the budget wasn’t tight
The Re-architecture: Embracing CDC
The options we evaluated spanned the full spectrum, from fully managed services like Fivetran and Estuary Flow to end-to-end self-managed database-log pipelines. We assessed semi-managed middle grounds, delegating specific components, and explored platforms we already run, like AWS Database Migration Service and Snowflake Openflow. Almost all options relied on Postgres Write-Ahead Logs (WAL) replication as the source and Snowflake as the destination.
| Option | Why it appealed | Why we ruled it out |
|---|---|---|
| Fivetran / Estuary Flow — fully managed | Turnkey, near-zero-ops CDC with excellent reliability. Estuary’s data-volume pricing is arguably better suited to us than Fivetran’s unique-row model. | Both pricing models scaled aggressively against our data profile and volume and incur separate Snowflake costs to apply real-time updates and backfill history. Being point-to-point into Snowflake, future backend services or ML models couldn’t consume these events without reading from Snowflake or standing up a second Postgres pipeline. Both also required an in-region private deployment (added cost) for data residency. |
| AWS DMS — self-managed on AWS | Already part of our AWS footprint; can move Postgres WAL straight to S3 | Widely reported as unreliable for continuous, high-throughput CDC (due to schema evolution, volume spikes, etc.). Failed tasks bloat Postgres replication slots and eat RDS disk, lacking the resilience and fine-grained configuration we needed. |
| Snowflake Openflow — managed / BYOC | Apache NiFi-based, runs securely within the Snowflake ecosystem, routes data straight into the warehouse | The fully managed version required either the Business Critical plan (private deployment/VPC peering, ~2x the cost of running through Snowflake) or a public database endpoint (a security non-starter). BYOC avoids this but adds operational overhead, a three-part pricing model (BYOC cloud + Openflow + Snowflake warehouse), and locks us into Snowflake. |
| Fully self-hosted stack — EC2/EKS Kafka + Debezium | Maximum control and, in theory, the lowest infrastructure cost | Unjustifiable operational tax: running a high-throughput Kafka cluster demands deep, specialized expertise (partition rebalancing, broker failures, OS-level patching), tying up engineering time on infrastructure instead of the pipeline. |
Two of these deserve a closer look. Snowflake Openflow was the closest call: even using a journal-table architecture (article) to let other applications read the CDC stream, we would still have been locked into the Snowflake ecosystem. And while a fully self-hosted stack promised the lowest infrastructure bill, committing to it meant pouring engineering hours into infrastructure upkeep instead of the data platform itself.
The Final Pipeline Architecture
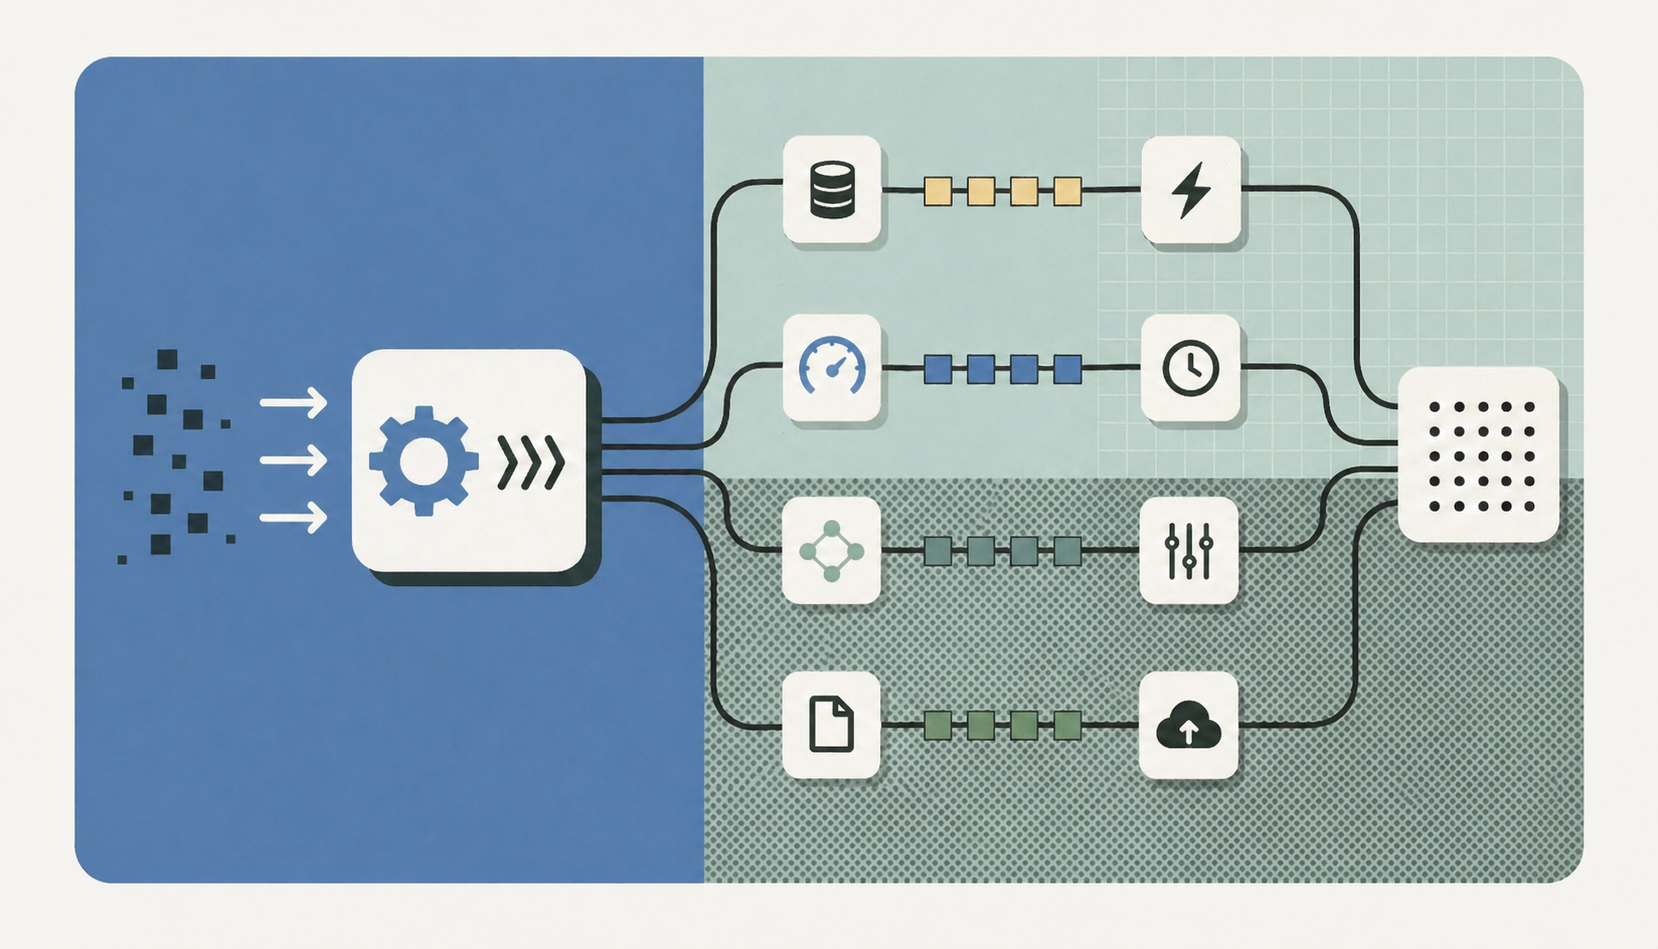
We found our sweet spot in a semi-managed architecture: managed services handle Kafka broker and Kafka Connect management, while we retain full control over connector configuration and downstream logic. This balanced the fine-grained control of a bespoke system with the operational ease of managed infrastructure, hitting our latency, scalability, and security goals without breaking the bank.
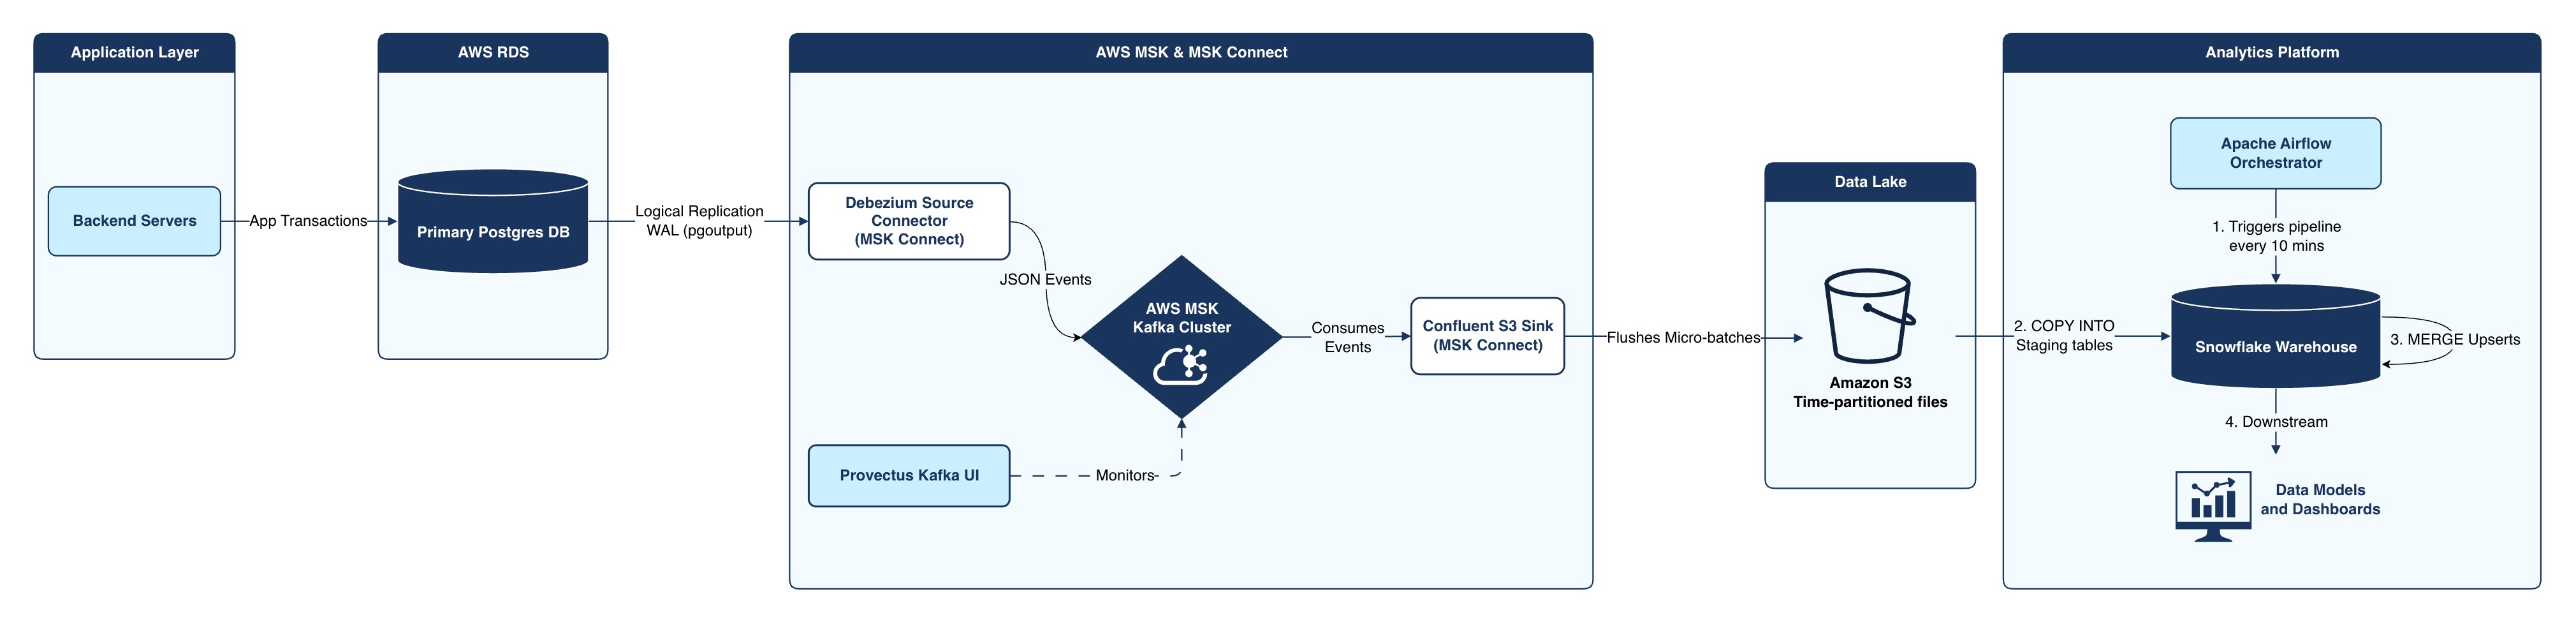
Here is the final pipeline, component by component.
1. Postgres Logical Replication & Publication
At the top of the funnel, we moved away from heavy SQL polling and tapped directly into the heart of CDC: the database transaction logs, which in Postgres are the Write-Ahead Logs (WAL).
- Enable logical decoding (and in turn logical replication) on the Postgres instance using the native
pgoutputplugin, which turns Postgres’s low-level WAL bytes into a readable stream of row-level changes for external consumers. - Create a publication: the set of changes, from one or more tables, that a subscriber replicates. It lets us pick exactly which tables and operations (
insert,update,delete) feed CDC, and stream only those WAL events.
We explicitly add tables to the publication rather than using FOR ALL TABLES, to prevent accidental exposure of sensitive or high-churn log tables.
2. The Event Stream: AWS MSK (Managed Streaming for Apache Kafka)
For our central event broker, we chose Apache Kafka managed by Amazon MSK, driven by two key decisions:
- AWS MSK vs. Other managed services: With our infrastructure already deeply embedded in AWS, MSK kept the broker entirely inside our Virtual Private Cloud (VPC), simplifying security and eliminating egress costs.
- MSK vs. AWS Kinesis: Kinesis is easier to manage, but Kafka’s ecosystem, specifically its first-class Debezium compatibility, is better suited to CDC. Kinesis fits lower-throughput workloads; forcing it to work for CDC would have required custom producers or AWS DMS.
To balance fault tolerance and cost, we provisioned a 3-node cluster using Express brokers on AWS MSK.
- 3 brokers: Deploying across three Availability Zones provides a robust quorum. If an entire AWS zone goes down, the cluster can still elect partition leaders and accept writes without data loss.
- Express brokers: Compared to Standard brokers, MSK Express brokers offer better throughput, easier partition rebalancing, and managed elastic storage (pay-as-you-go). They remove the overhead of manually provisioning EBS volumes and configuring replication factors or policies, relieving the operational burden of running Kafka.
We keep a 7-day retention on every topic — a comfortable replay buffer if a downstream pipeline or Airflow DAG fails. At that retention, the cluster holds around a billion messages, with a peak inflow of ~400k messages per minute. Transaction log throughput peaks near 50 MB/s from Postgres.
Data layout design mattered as much as cluster sizing: we configured a single topic per table and a single partition per topic. Table-level isolation is crucial for downstream consumer design. A single partition per topic guarantees chronological precision, removing any need to reason about event ordering. However, if a table’s volume grows large, its topic should be repartitioned to spread data across multiple partitions so a consumer group can process events efficiently.
Alongside CloudWatch metrics, we deployed the open-source Provectus Kafka UI for message-level visibility into the cluster — topics, consumer groups, and the actual JSON payloads of our CDC events. It lets us monitor consumer lag, verify producer output, and trace specific transactions through the stream, accelerating development and debugging. (Payload access is locked down; see Security below.)
3. Debezium Source Connector
To extract WAL events, we deployed the Debezium connector on AWS MSK Connect, avoiding a self-hosted Kafka Connect cluster on EC2 or EKS. Rather than manually managing topics, the connector dynamically creates them as tables join the publication, using guardrails to match our cluster topology and apply consistent configurations.
Debezium creates a logical replication slot on the database for the publication and consumes every published event, scoped strictly to the public schema. We disable Debezium’s ability to manage database-level publications or attempt DDL (publication.autocreate.mode = disabled) — we own the named publication and slot ourselves. Producers require acks = all so every in-sync replica must acknowledge a message before it is considered written.
For event storage, we apply gzip level 2 compression at the producer, preserving it through to the sink. Our testing showed level 2 delivers significant storage savings without throttling CPU throughput at scale. Auto- created topics get 1 partition, replication factor 3, and our 7-day retention policy stamped at creation time.
What a CDC event looks like
When a row changes — for example, a user updating their email — Debezium reads the WAL and constructs a Kafka message. The primary key goes in the message key and the change payload in the message value. Keying on the PK ensures all updates for a given row always hash to the same partition (even if we scale partition count later) and lets downstream consumers identify the affected row.
// Kafka Message Key
{ "id": 1234 }

// Kafka Message Value
{
  "before": null,
  "after": {
    "id": 1234,
    "email": "[email protected]",
    "updated_at": "2026-06-30T12:00:00Z"
    // ... other columns
  },
  "source": { "ts_ms": 1782103512219, "table": "users", ... },
  "op": "u",
  "ts_ms": 1782103512456
}
Key payload details: after carries the row’s full column set, not just changed columns; we partition on source.ts_ms (the transaction-commit time captured from the WAL) rather than the root ts_ms (connector processing time); op marks the operation (u=update, c=create, d=delete).
REPLICA IDENTITY DEFAULT means only the primary key is emitted as the event key, and for a typical update that touches no PK column, the
beforepayload is dropped.Other options include REPLICA IDENTITY FULL, which makes Debezium populate the
beforefield with the row’s entire previous state, and USING INDEX unique_index, which does the same using the columns of a chosen unique index.The
beforeandafterpayloads are always null forINSERTandDELETEevents respectively.Setting REPLICA IDENTITY FULL carries a significant performance penalty and increased disk I/O on the database, but a downstream consumer may still require it for a given table. We revisit this trade-off under TOAST handling below.
4. S3 Sink Connector
To move data off the Kafka event bus and into cold storage for the warehouse, we deployed the Confluent S3 Sink Connector. It continuously consumes topics and flushes events into our S3 data lake. This component strictly handles micro-batching, turning an infinite stream into discrete, digestible files for Snowflake. We flush files every 10 minutes or 100k events (whichever comes first), and the downstream processing job runs on the same cadence. If a use case needs faster data, we simply tighten the flush configuration.
We specifically use wall-clock rotation (rotate.schedule.interval.ms), not rotation relative to the first event in a file (rotate.interval.ms), so even low-traffic periods still meet the SLA. Events are stored as gzip-2 JSON files, time-partitioned on source.ts_ms — the actual database transaction-commit time from the WAL, rather than a timestamp set by the ORM.
5. Orchestration & Warehouse: Airflow to Snowflake
The final mile brings the data into our analytical ecosystem. The data sits in Kafka within seconds of a database commit, but we use the sink connector’s micro-batching together with Airflow to orchestrate loading into Snowflake at a predictable, optimized cadence.
Every 10 minutes, an Airflow DAG triggers the following sequence:
- Stage: Lightweight
COPY INTOcommands load the newly arrived, time-partitioned S3 files into raw staging tables in Snowflake. - Deduplicate: Within each micro-batch, keep only the latest event per primary key.
- Upsert: A
MERGEstatement runs against the primary application tables in the warehouse. By comparing primary keys, operation type, and event timestamps against existing warehouse data, Snowflake inserts new records and updates modified ones in a single pass.
Challenges & Engineering Trade-offs
Moving from a predictable 12-hour batch job to a continuous, high-throughput streaming architecture surfaced plenty of edge cases. Here is what broke, what we compromised on, and how we solved it.
Cutover Strategy & Data Validation
We needed to migrate off the legacy Airflow batch pipeline without dropping a single row or causing downstream downtime.
Solution: Because Snowflake already held our historical data, we skipped Debezium’s initial snapshot phase entirely (snapshot.mode: no_data). We turned on the CDC pipeline while the batch pipeline was still running to create a deliberate overlap window; our Snowflake MERGE logic seamlessly deduplicated any events processed by both. To confidently cut the cord, we ran CDC against a cloned Snowflake table and performed full data comparisons between the legacy batch and new CDC pipelines to prove 100% accuracy. With parity established, we deployed Great Expectations for automated reconciliation, comparing random row samples and aggregate counts, which we still run on a schedule.
Handling Postgres TOAST Values
Postgres uses a mechanism called TOAST to store oversized column values (large text blocks or JSON payloads pushing a row past the ~2KB TOAST threshold). If a row is updated but its TOASTed column is unchanged, logical replication doesn’t re-send the value to save bandwidth. Instead, Debezium emits a placeholder: __debezium_unavailable_value.
Trade-off: We could have forced Postgres to send the full row every time by setting REPLICA IDENTITY FULL, but that would severely impact database performance and inflate Kafka storage costs. Instead, we handled the complexity downstream. We updated our Snowflake MERGE and deduplication SQL so that when the warehouse encounters __debezium_unavailable_value, it falls back to the target table’s last known value rather than overwriting good data with the placeholder.
Message Size Limits
During early testing, the Debezium connector crashed on a large JSONB payload exceeding Kafka’s default 1MB message-size limit and Debezium’s default producer limit.
Solution: A bottleneck anywhere in a streaming pipeline blocks everything, so we uniformly raised message and fetch size limits across the chain — MSK broker topics, Debezium producer, and S3 sink consumer — handling payloads up to ~10MB.
MSK Connect Autoscaling Limits
We planned to use MSK Connect autoscaling to add S3 sink workers during traffic spikes. But it only scales on CPU utilization, and our S3 sink is heavily memory-bound. It would hit memory limits long before the CPU ever crossed the scale-out threshold.
Trade-off: We abandoned dynamic autoscaling. Since Debezium is inherently single-threaded per replication slot, we statically provisioned the MSK connectors with a single worker and a higher MCU (Memory/Compute Unit) count.
Managing Schema Evolution
Our Postgres version does not publish Data Definition Language (DDL) changes through logical replication. If the product team ships a migration, Debezium picks up the new column, but Snowflake wouldn’t know where to put it.
Solution: Because database migrations are managed centrally, we added a trigger to our backend migration job: whenever a production migration runs, it fires a separate Airflow pipeline to synchronize the forward schema change directly to Snowflake. (Backward-incompatible changes, like dropping columns, are still managed via manual engineering SOPs.)
WAL Accumulation
If MSK goes down or the Debezium connector crashes, the Postgres logical replication slot stays active. Postgres holds WAL files indefinitely until Debezium acknowledges them, eventually consuming all available RDS disk space and taking down the database.
This is the highest-risk scenario in CDC, so we implemented strict guardrails:
- Set maximum WAL capacity limits on RDS.
- Kept the database heavily over-provisioned on free disk space to buy time for manual intervention.
- Piped RDS and MSK CloudWatch metrics into our central observability platform, with aggressive paging alerts tied to replication-slot growth and consumer lag, backed by a manual intervention SOP.
Airflow and Snowflake Optimizations
Running an ingestion pipeline every 10 minutes can easily send compute costs spiraling and create Airflow task bottlenecks.
- Airflow concurrency: The S3-to-Snowflake tasks are purely I/O-bound (waiting on Snowflake). We spun up a dedicated Airflow worker and configured higher-concurrency Airflow pools so a large number of table updates could run simultaneously without starving other DAGs.
- Snowflake compute: We tuned our virtual warehouse sizes and run multiple parallel warehouses mapped to parallel jobs. Because the
COPY INTOandMERGEoperations complete in under 5 minutes, we set an aggressive auto-suspend on the Snowflake warehouses.
Rethinking Downstream Consumption
Moving to near real-time data meant rethinking our entire downstream analytics. Running massive dbt models every 10 minutes wasn’t feasible, so we decoupled ingestion from transformation. Raw tables refresh continuously, while BI-tool cache resets and materialized-view refreshes are tuned to specific business needs. Heavy, full-refresh transformations remain on less frequent schedules.
Hardening Data Security
Streaming raw database changes into a central broker creates a large new security perimeter: raw events contain PII and sensitive application data. To enforce security:
- We severely locked down the Provectus Kafka UI. Message payload access requires explicit, temporary engineering approval, while payload-free broker-level metrics are accessible more freely.
- S3
GETaccess to the raw event bucket is globally restricted. - Downstream Snowflake users never query the raw CDC staging tables. They only access a sanitized, final view of the merged tables, ensuring our strict data access-control policies remained intact and were never compromised throughout the migration.
The Cost Conversation
The honest answer is nuanced: the CDC platform costs more than the batch pipeline it replaced, but it is worth it.
The biggest driver is Snowflake compute. Applying continuous MERGE upserts every 10 minutes is meaningfully more expensive than a twice-daily batch merge. Near real-time data also unlocked new analytics usage that further drove spend. Despite choosing a cost-conscious architecture — semi-managed, skipping full backfills — the all-in cost still increased significantly. The value from faster decisions, real-time monitoring, and higher data reliability far outweighs that increase.
Business Impact
- From retrospective to real-time analytics: Data freshness improved from a 12-hour to an average 10-minute lag. What used to be a morning review of yesterday’s data is now a live pulse of the business. Dashboards now reflect intraday performance and real-time metrics that were simply impossible to run against Postgres.
- Accelerated RCAs and anomaly detection: Previously, detecting an issue meant waiting for the next batch run or writing limited queries against the production database. Now, teams diagnose issues almost instantly using computationally intensive queries in Snowflake, completely isolated from the production database.
- Operational stability: We achieved this speed while completely isolating our primary Postgres databases from analytical workloads. The backend is oblivious to downstream analytics consumption, maximizing customer uptime and eliminating the unexpected load our replicas took during legacy pipeline runs.
- Higher data reliability: Capturing every committed change directly from the WAL resolved the legacy accuracy gaps, eliminating cross-table inconsistencies and rows lost to race conditions.
- A future-proof foundation: By placing a Kafka event bus at the heart of our data platform, we built a centralized, scalable, and strictly governed event stream ready for any future use case.
Future Roadmap
This architecture comfortably handles our current throughput and analytical needs, but data platforms are never truly “finished.” Here is what we are looking at next:
- Scaling with multi-partition topics: To guarantee strict chronological ordering without complex downstream deduplication, we currently enforce a single partition per topic. As our largest tables grow, this will eventually become a bottleneck. We plan to migrate high-volume tables to multi-partition topics, using consistent primary-key hashing so events for the same row always land in the same partition, unlocking parallel throughput while preserving order.
- Plugging in new consumers: Because of our decoupled architecture, the Kafka cluster is more than a transport layer for Snowflake. We are exploring tapping into Kafka directly for other use cases without touching the primary database.
- Streaming analytics: While 10-minute micro-batching is enough for our current warehouse needs, frameworks like Apache Flink remain an option for continuous, stateful aggregations on the Kafka stream before data lands in cold storage.
Disclaimer: All personally identifiable information (PII) used in the experiments described in this post was anonymised before analysis. No raw PII is included in the results, examples, or diagrams shared here.
Comments
Loading comments…